Lecture on cosmic ray flux variations and its effect on the climate
Here is a speech by Nir Shaviv. In this speech he shows how the amount of cloud and temperature of the Oceans follows changes in the cosmic ray flux.
Dr. Nir Shaviv is a physicist who has suggested that period of ice ages happens because more intense cosmic rays hit Earth when the Solar System travels through the arms of the Milky Way. When the solar system is located outside the spiral arms of the Milky Way which is most of the times, the climate on Earth is warmer than it is now. The Earth is currently in an ice age period and this period has lasted for about 3 million years. We are in a short break from the resent glaciation, called the Holocene interglacial period.
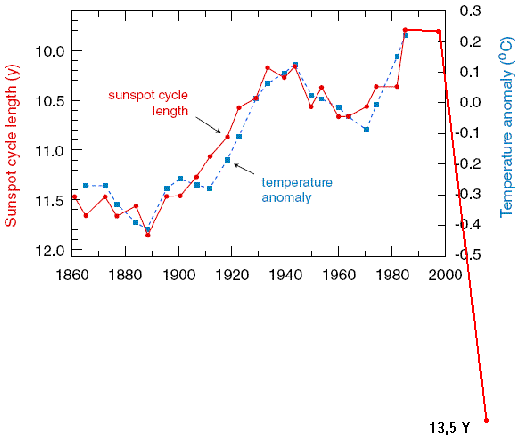
This graph is based on a correlation between the length of solar cycles and the global temperature trends which was examined by two Danish researcher Friis-Christensen and Lassen in 1991. I have added the temperature drop at the end of the graph for how large it should be if this correlation hold for the latest solar cycle length which was the largest for over 200 years.
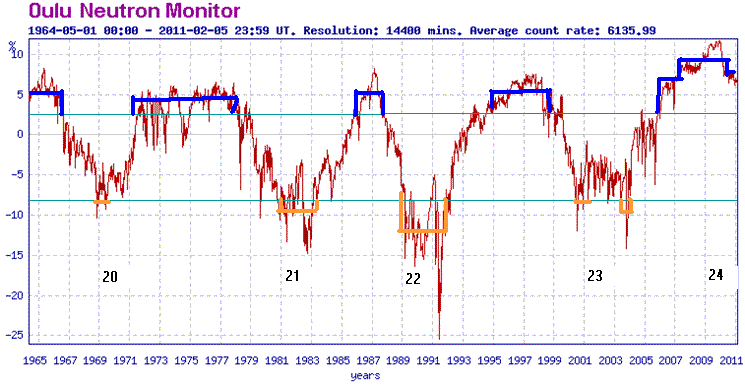
This is a graph is from a neutron counter in Oulu, Finland. Its measure is equivalent to the cosmic ray flux. The higher the count the cooler the Earth gets. The lower the count gets the higher the temperature gets. If more cosmic rays hits Earth, the more clouds is formed and more sunlight is reflected back out into space, thus the Earth cools. I have colored the extreme values for warming in orange and for cooling in blue. One can clearly see that the cosmic ray flux is related to solar cycles. When the Sun is active the cosmic ray flux is low and when it is less active the ray flux is high. During the recent warming between 1975 and 2000, the peak during the high point of the solar cycles were high. Right now the Sun is in an unusual inactive state and the cosmic ray flux is very high, indicating a cooling trend. This is shown at the top right end of the graph.
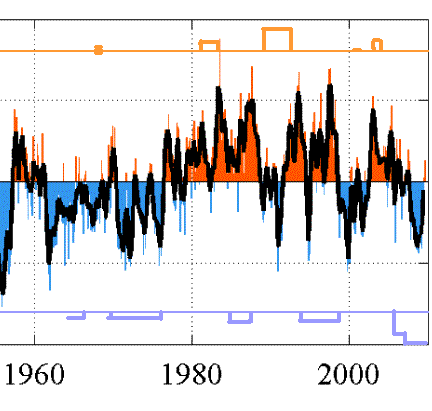
In this graph of PDO “The Pacific Decadal Oscillation”. I have added the marking from the previous graph. One can see that the PDO and the cosmic ray flux follow each other and subsequently the cooling which occurred between 1950 and 1975 and the warming which occurred between 1975 and 2000 can be attributed to a large extent to the cyclical temperature variation of the PDO which probably is solar driven. This is contrary to the claims by the IPCC which states that with 90% confidence, human anthropogenic warming is the main cause for the warming since 1950. This statment is not based on the data and is clearly false.
Human caused global warming in Minnesota? I don’t think so. If you see Al Gore and the hockey stick man Michael Mann in this video then it is only coincidental.
BTW. The snow in the previous post didn’t show up in Houston as expected. Instead it went north and hit Dallas. Yesterday and today once again the deep US south was experiencing a white out with heavy snow. This time it is Oklahoma, Arkansas, Tennessee with Nashville and Atlanta which get the snow.


One Response to The implications of correlation between solar activity and Pacific Ocean heat content, a new Little Ice Age is coming soon!